nicole@portfolio:~/projects/turing-simulations$ cat README.md
Turing Pattern Simulations
Extended Fourier and spectral analysis tools for simulating morphogenesis patterns and integrated real-time interactive hardware visualization.
Git · UART · C++
Overview
In 1952, Alan Turing published in Philosophical Transactions "The Chemical Basis of Morphogenesis", proposing a reaction-diffusion model for the spotaneous organization of a field of homogenous cells. Amplification of small, random fluctuations caused by local activation and long-range inhibition could cause complex spatial patterns to emerge, later termed Turing patterns.
At the Morsut lab, I focused on applying these principles of reaction-diffusion to engineer multicellular circuits by programming how individual stem cells communicate. The architecture we used deviated from conventional architectures in that activation was facilitated via juxtacrine rather than paracrine. In other words, instead of a short-range diffusible activator, activation propagation depended on neighboring cell-to-cell interactions, making the system more discrete and reducing the number of continuous parameters that must be tuned in order to achieve stable patterns.
Implementation
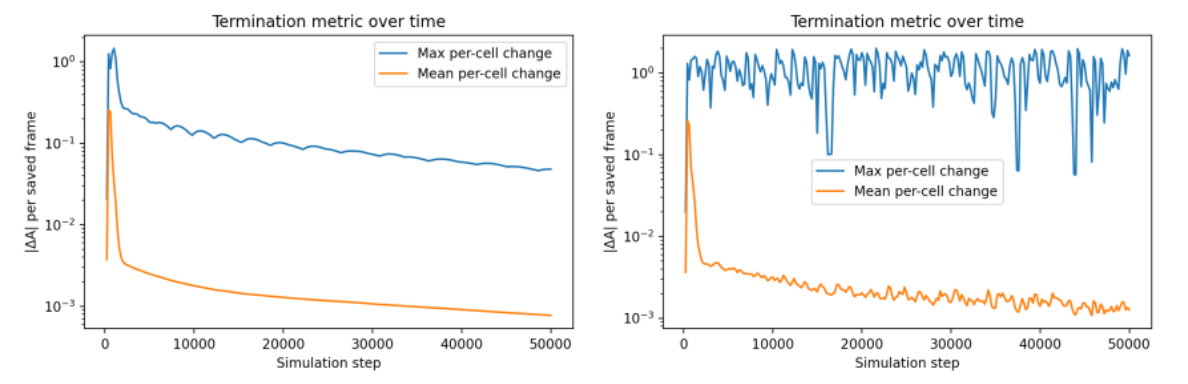
Building off the existing codebase, I expanded the simulation and analysis framework to better characterize the dynamics of the JAPI circuit. The existing model simulates a two-dimensional field of cells whose states evolve according to local activation and inhibition. Initially, the termination condition was a fixed number of steps, but this could result in early termination before convergence, or otherwise a delayed termination that becomes very inefficient when running large batches of simulations. I tracked both mean and maximum change in cell states between successive timestamps, and found that while max per-cell change could remain elevated due to slow drift from continuous stochastic nucleation, mean per-cell change provided a good indication of global convergence, which justified a new termination condition.
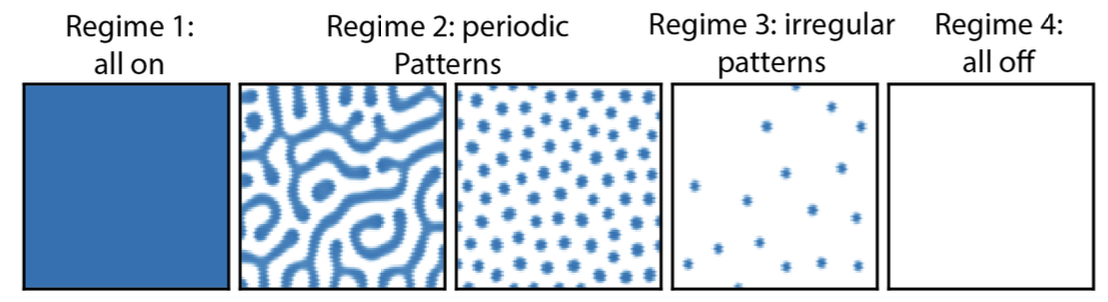
From there, I combined spatial FFT and autocorrelation analysis tools to form a cohesive quantitative pipeline. A major focus of my work was developing a way to quantitively characterize patterns that had previously been distinguished largely by their appearance. Regimes were manipulated via the inhibitor production rate variable. Spatial FFT and autocorrelation analysis provided information on wavelength, periodicity, and characteristic length, but still could not completely describe the geometry of the patterns. Thus, I applied a binary mask to the cell field and developed a second set of metrics.
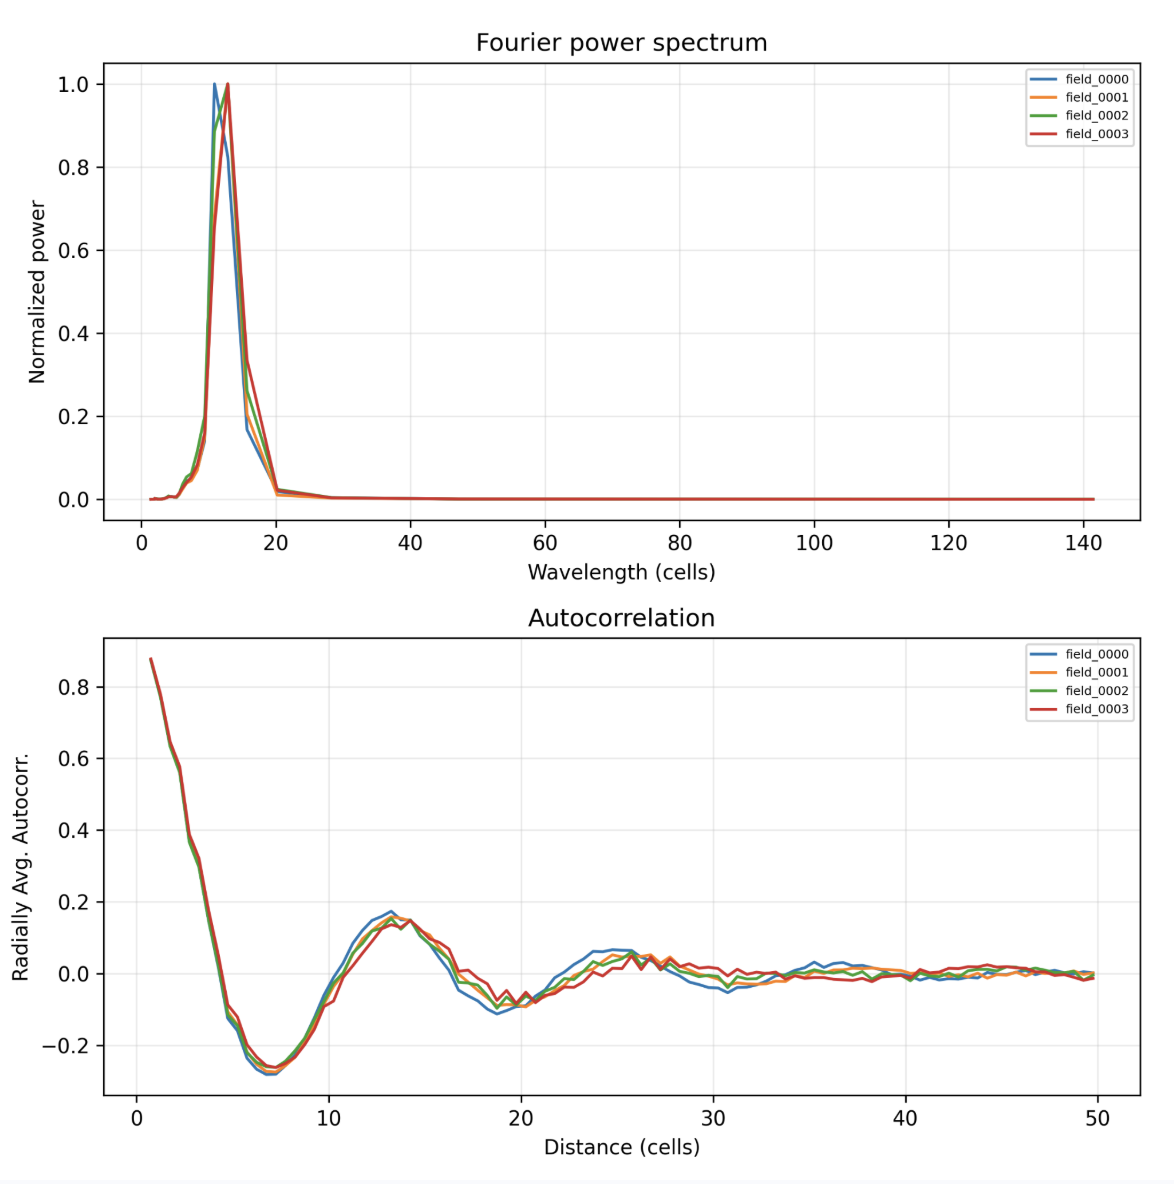
To convert the continuous activation field into a discrete, digital one, I explored both fixed and dynamic thresholds selected using Otsu's method, then filtered smaller components to account for nucleation noise. From the resulting binary field, I measured the fraction of activated cells, number of connected domains, average domain size, as well as mean and standard deviation of nearest-neighbor distance between domains. Dynamic Otsu thresholding tends to better account for the variation in strength of activation across changes in inhibitor production rate, and was thus used to produce the binary masks seen in Fig. 4. Provided below is also an example of how FFT and autocorrelation changes as the regime moves from Turing to irregular.
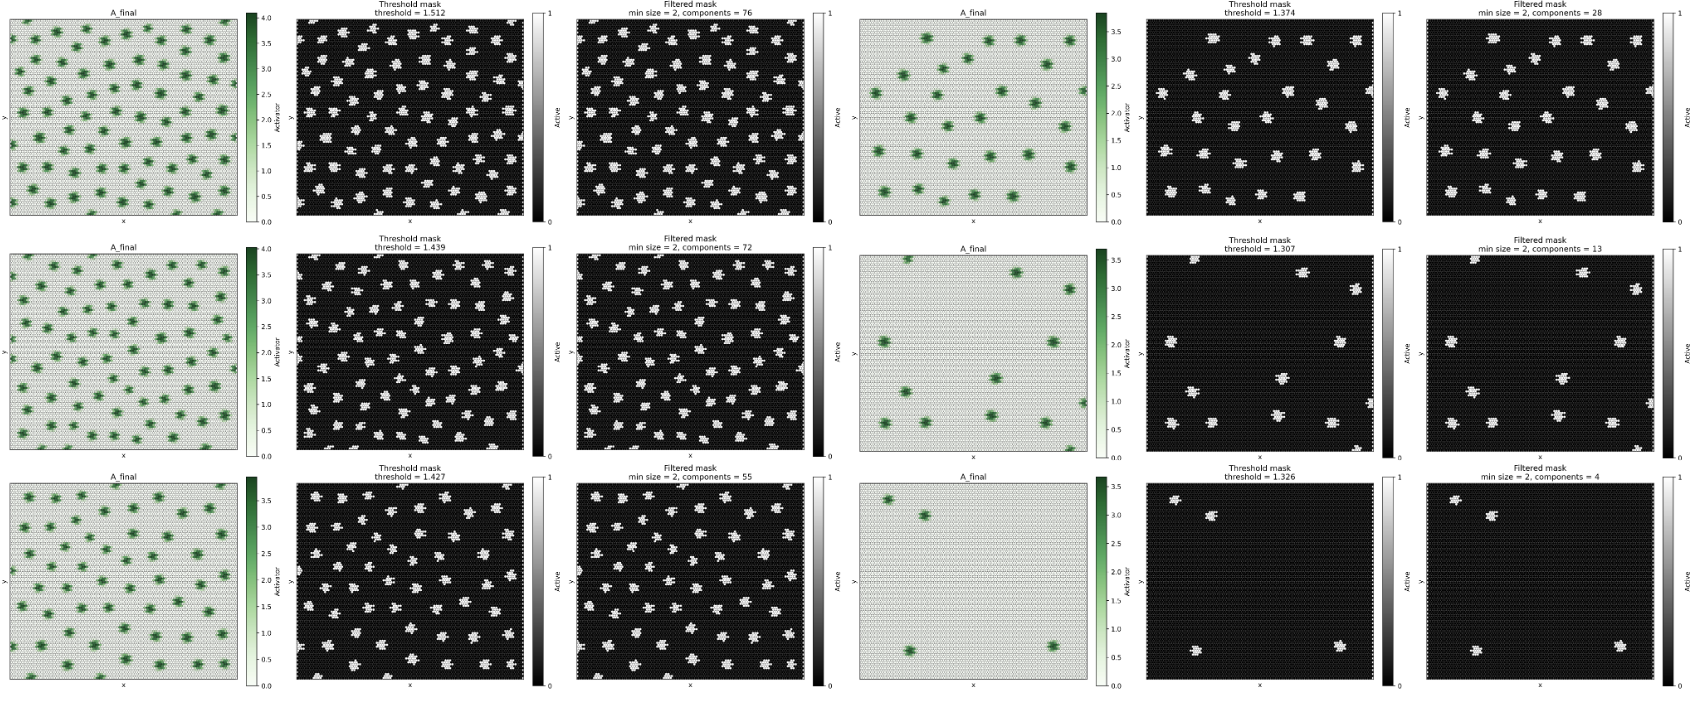
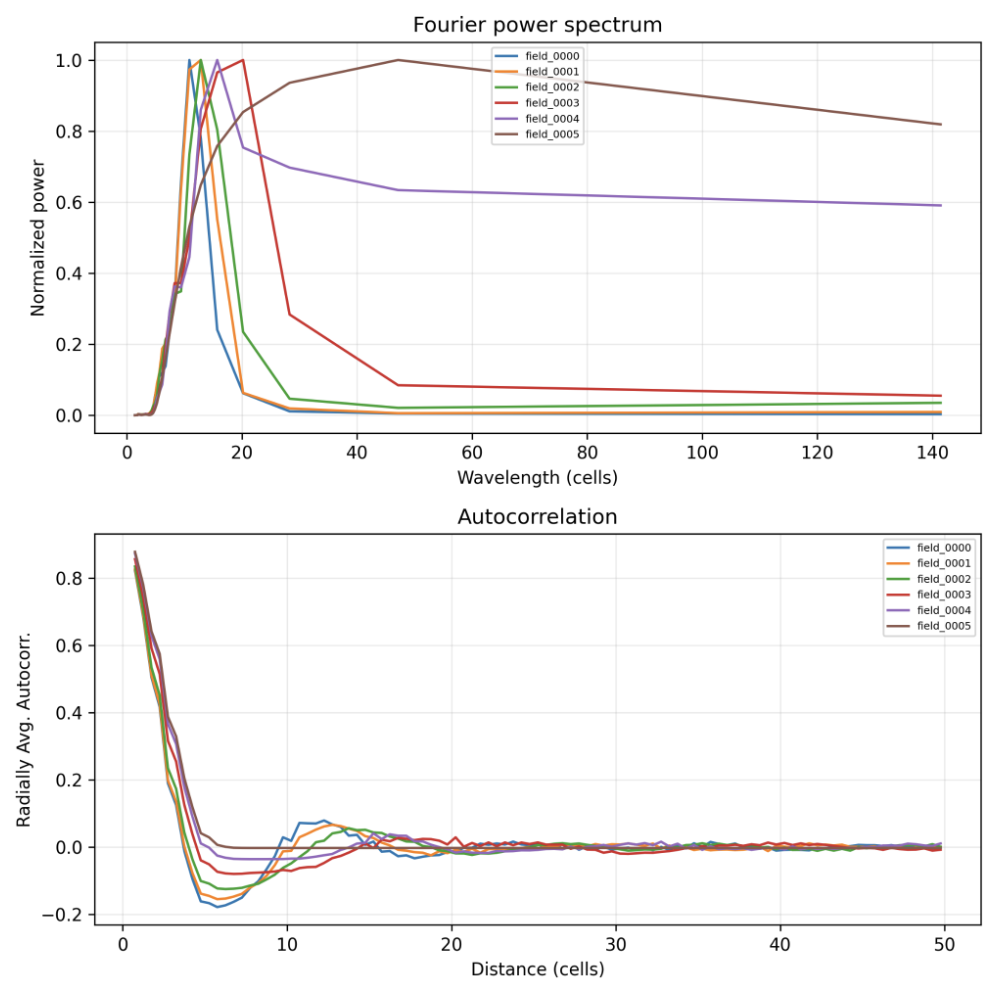
The boundary between Turing and irregular patterns is significant because it identifies the reliable operating range of a gene circuit. In stem cell engineering, controlling cell organization requires predictability and room for error. Using metrics from my analysis can predict the regularity of a pattern. For example, from the first to last simulation of the sweep, mean nearest-neighbor distance increased from approximately 9.94 to 39.79 cell units, while standard deviation increased from 0.72 to 22.25.